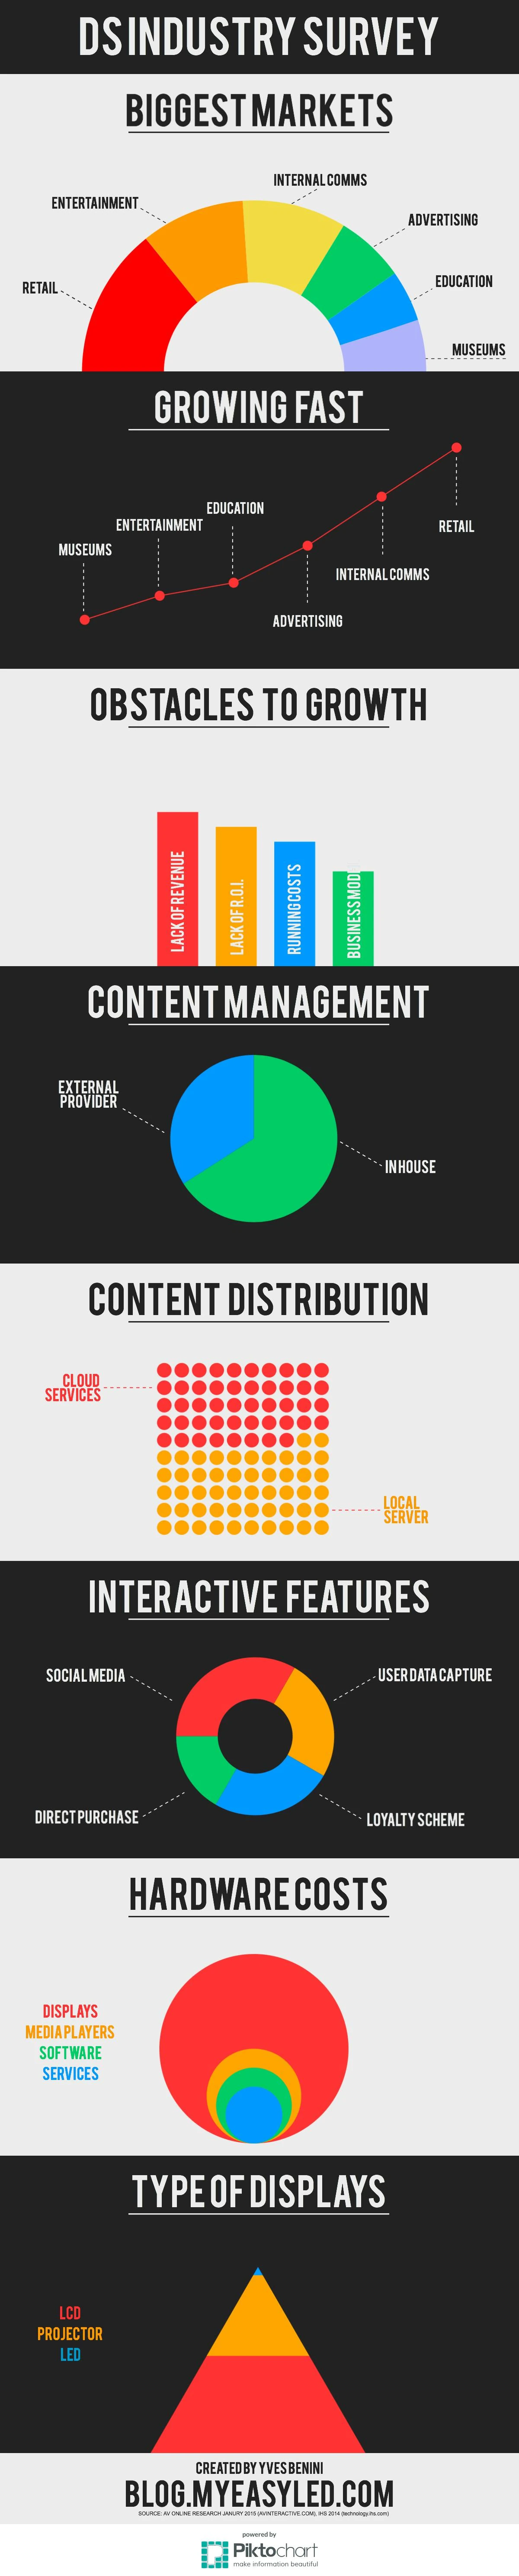
In 2015 we published an infographic on the state of the digital signage industry, drawing on research by AV Online (January 2015) and IHS (2014). It is still the most useful thing we ever put on the old blog, and not because the numbers hold up. They do not. It is useful because of one panel at the very bottom.
That panel was a pyramid of display types. LCD was the base — most of the market. Projection sat above it. Direct-view LED was the tip: a specialist item, mostly outdoor advertising, mostly too expensive and too coarse for anything indoors.
A decade later that pyramid has inverted at the top end of every market it described. Understanding why it inverted tells you far more about where to spend your time now than any ranking of verticals could.
What the survey said in 2015
Rankings rather than figures, since a decade-old percentage is worse than useless. In order:
- Biggest markets: retail, then entertainment, internal communications, advertising, education, museums.
- Growing fastest: the same list, near enough reversed at the bottom — retail and internal comms leading, museums trailing.
- Obstacles to growth: lack of revenue first, then lack of demonstrable ROI, running costs, and business model.
- Hardware spend: displays dominating so completely that media players, software and services together sat as a small cluster of circles inside the one for screens.
- Content: a clear majority made in-house rather than by an external provider, and already more distributed from the cloud than from a local server.
Read those together and the story is obvious in hindsight. The industry’s problem was not demand. It was that screens cost too much to justify, and everyone knew it — “lack of revenue” and “lack of ROI” are the same complaint from two directions.
What actually changed
Not the verticals. The price of a square metre of pixels.
LED did not win a market from LCD by being better; it was always better. It won by falling through the price point at which a client stops asking for a business case. Once a boardroom screen costs what a decent projector installation used to cost, the ROI question quietly stops being asked — and the survey’s number one and number two obstacles both evaporate at once.
The second change is that the hardware-dominated cost ring flattened. Displays are still the biggest line, but content, software, connectivity and service are now a real and recurring share. That matters to a reseller more than the display price does: it is the part that repeats.
Where the volume is now
The honest version, market by market, as they behave in a quotation.
Retail
Still the largest and still the fastest, and the most brutal on price. Flagship stores buy fine pitch and buy it beautifully; the chain rollout behind them buys the cheapest thing that works, fifty times. The two are different businesses and pretending otherwise is how a distributor loses money on a framework agreement.
Where the margin actually is: the rollout, but only if you can quote it in an afternoon and repeat the quote in every territory. That is a tooling problem, not a sales problem.
Corporate and internal communications
The market that has changed most, and the best place to be right now. Boardrooms, town-hall spaces, reception walls, briefing centres. The buyer is IT or facilities rather than marketing, the budget is capital rather than campaign, and — critically — they buy a product rather than a project, which is exactly what all-in-one panels are for.
Short sales cycle, sensible margins, and it repeats: an organisation that puts a screen in one meeting room puts one in the next four.
Control rooms
Small by volume, large by value, long by cycle. Utilities, transport, security, broadcast. Fine pitch, high reliability, redundancy, service contracts — and the one indoor market where tiled LCD is still genuinely competitive, because operators sit close and read dense data.
Worth pursuing if you can support it. Punishing if you cannot: these clients buy the maintenance, not the screen.
Sport and live events
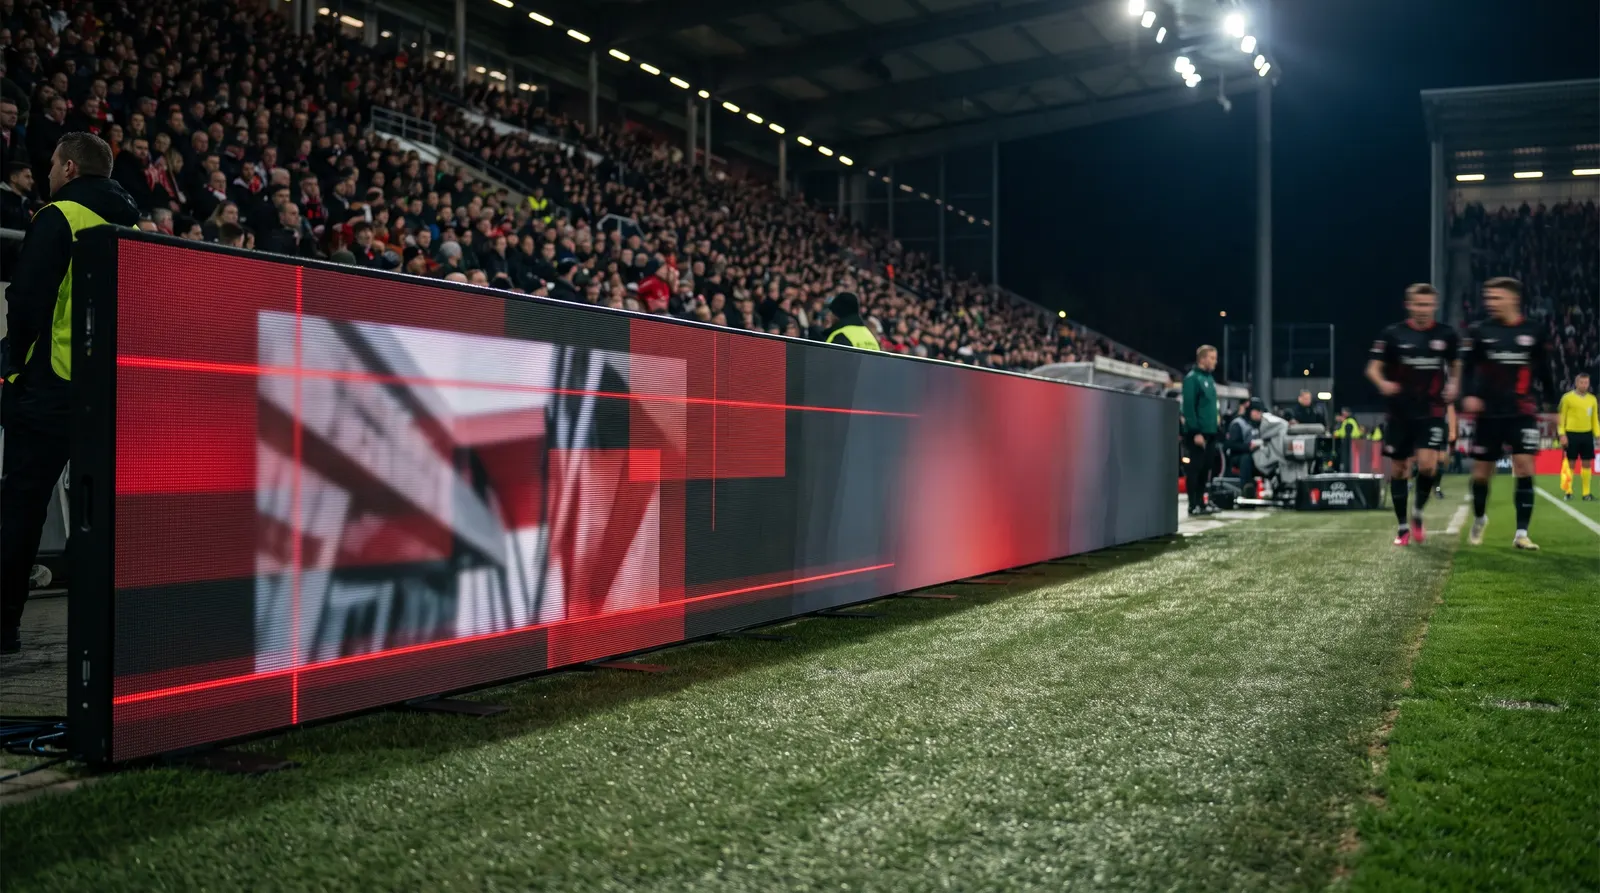
Perimeter boards, scoreboards, big screens, and a rental economy alongside the fixed installs. Priced per linear metre for perimeter, which catches out anyone quoting per square metre. Highly seasonal, competitive, and dominated by relationships — but a stadium is a reference that opens every other door in the region.
Advertising and DOOH
The market that most resembles 2015, because its economics are unchanged: the screen is a revenue asset and the operator does the arithmetic properly. They will interrogate your power figures, your brightness, your dimming schedule and your service response time, because all four are lines in their own model.
Sell to them with numbers. It is the one vertical where a running-cost calculation on the quotation is expected rather than impressive.
Education and museums
Both were at the bottom of the 2015 growth ranking and both have moved up, for opposite reasons. Education buys on grant cycles — long, unpredictable, and worth tracking rather than chasing. Museums and visitor attractions have become genuinely interesting: they buy shaped, curved and immersive installations that nothing except LED can do, they have design budgets rather than IT budgets, and they are the least price-driven client in the entire trade.
The lesson the survey actually teaches
Every obstacle on that 2015 chart was, underneath, the same obstacle: nobody could show the number. Lack of revenue, lack of ROI, running costs, business model — four ways of saying that the industry was selling screens on how they looked and being asked to justify them on what they cost.
That has not changed at all. What has changed is that the answers now exist and are calculable: power draw, heat load, life to half brightness, cost per year, cost per square metre of usable resolution. The seller who brings those to the meeting is not competing on price, because nobody else in the running has brought them.
Which is the whole reason easyLED exists. Every manufacturer will give your client a calculator that stops at the specification. The commercial half — your cost, your margin, your warranty terms, your payment split, your logo on the offer — is the half nobody gives away, and it is the half that actually wins the order.